Edit chart
Loading graph
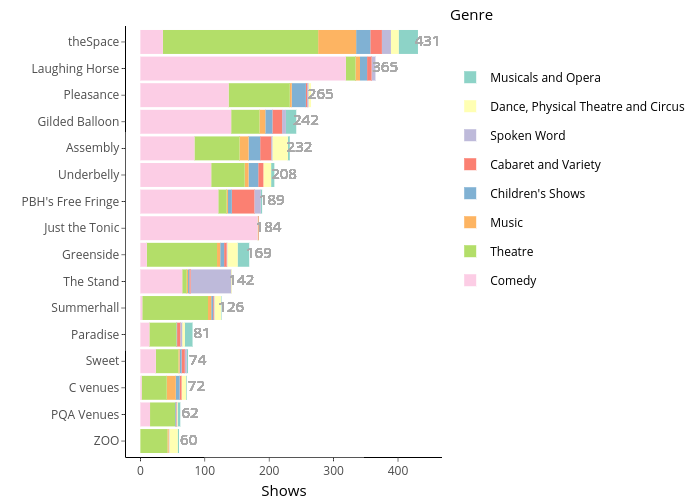
Alasdair_sykes's interactive graph and data of "Musicals and Opera, Dance, Physical Theatre and Circus, Spoken Word, Cabaret and Variety, Children's Shows, Music, Theatre, Comedy, Musicals and Opera, Dance, Physical Theatre and Circus, Spoken Word, Cabaret and Variety, Children's Shows, Music, Theatre, Comedy" is a , showing Musicals and Opera, Dance, Physical Theatre and Circus, Spoken Word, Cabaret and Variety, Children's Shows, Music, Theatre, Comedy, Musicals and Opera, Dance, Physical Theatre and Circus, Spoken Word, Cabaret and Variety, Children's Shows, Music, Theatre, Comedy; with Shows in the x-axis. The x-axis shows values from -22.3 to 468.3. The y-axis shows values from 0.4 to 16.6. This visualization has the following annotation: Genre