Edit chart
Loading graph
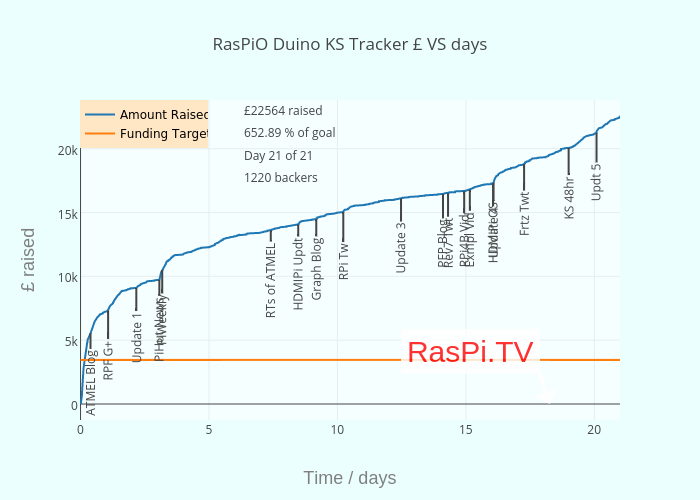
Alexeames's interactive graph and data of "RasPiO Duino KS Tracker £ VS days" is a scatter chart, showing Amount Raised vs Funding Target; with Time / days in the x-axis and £ raised in the y-axis.. The x-axis shows values from 0 to 20.9993. The y-axis shows values from -1253.5555555555554 to 23817.555555555555. This visualization has the following annotations: RasPi.TV; ATMEL Blog; RPF G+; Update 1; PiHut News; PiWeekly; RTs of ATMEL; HDMIPi Updt; Graph Blog; RPi Tw; Update 3; PFP Blog; Rev7 Twt; RPi4B Vid; Exmpl Vid; Update 4; HDMIPi OS; Frtz Twt; KS 48hr; Updt 5; £22564 raised; 652.89 % of goal; Day 21 of 21; 1220 backers