Edit chart
Loading graph
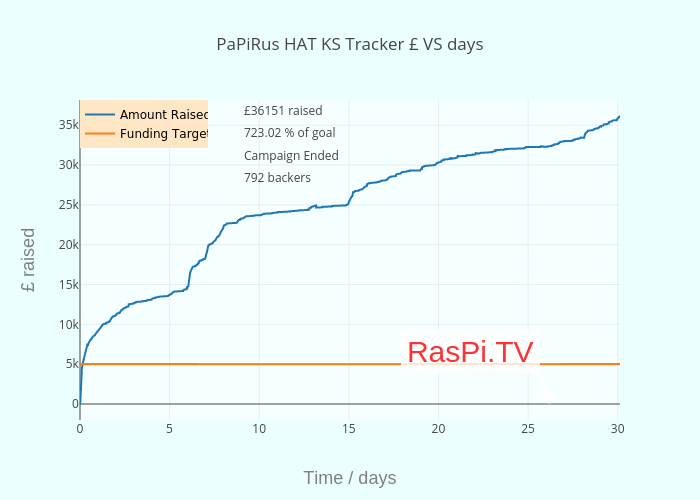
Alexeames's interactive graph and data of "PaPiRus HAT KS Tracker £ VS days" is a scatter chart, showing Amount Raised vs Funding Target; with Time / days in the x-axis and £ raised in the y-axis.. The x-axis shows values from 0 to 0. The y-axis shows values from 0 to 0. This visualization has the following annotations: RasPi.TV; £36151 raised; 723.02 % of goal; Campaign Ended; 792 backers