Edit chart
Loading graph
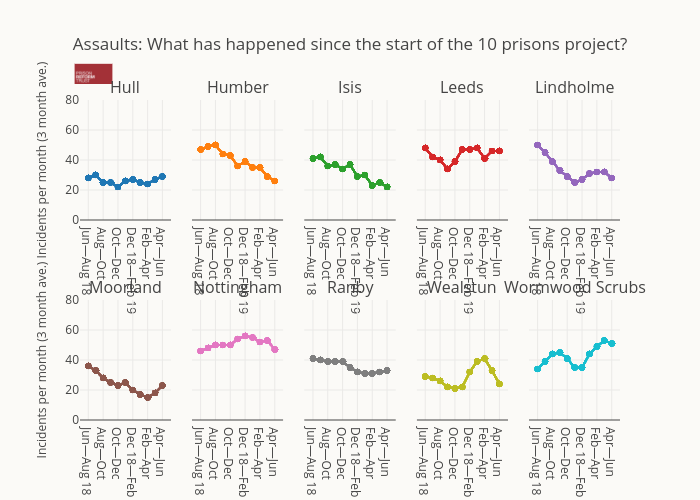
Alexhewson's interactive graph and data of "Assaults: What has happened since the start of the 10 prisons project?" is a scatter chart; with Incidents per month (3 month ave.) in the y-axis. The x-axis shows values from 0 to 0. The y-axis shows values from 0 to 80. This visualization has the following annotations: Hull; Humber; Isis; Leeds; Lindholme; Moorland; Nottingham; Ranby; Wealstun; Wormwood Scrubs