Edit chart
Loading graph
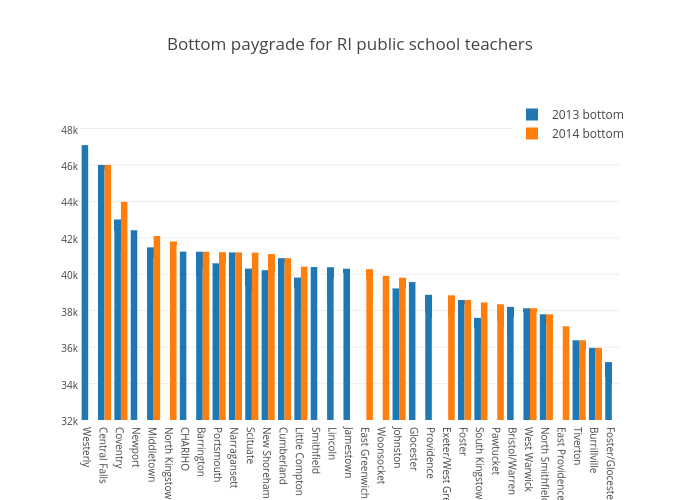
Alexkg413's interactive graph and data of "Bottom paygrade for RI public school teachers" is a bar chart, showing 2013 bottom vs 2014 bottom. The x-axis shows values from -0.5 to 32.5. The y-axis shows values from 32000 to 49565.26315789473.