Edit chart
Loading graph
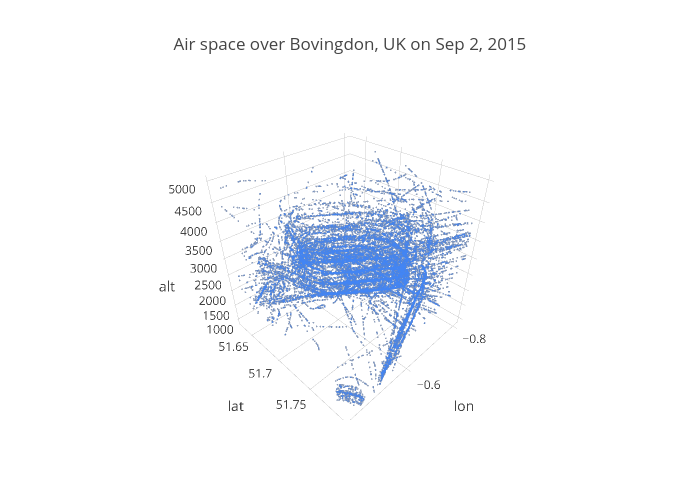
Alexrenz's interactive graph and data of "Air space over Bovingdon, UK on Sep 2, 2015" is a scatter3d, showing y. The x-axis shows values from 0 to 0. The y-axis shows values from 0 to 0.