Edit chart
Loading graph
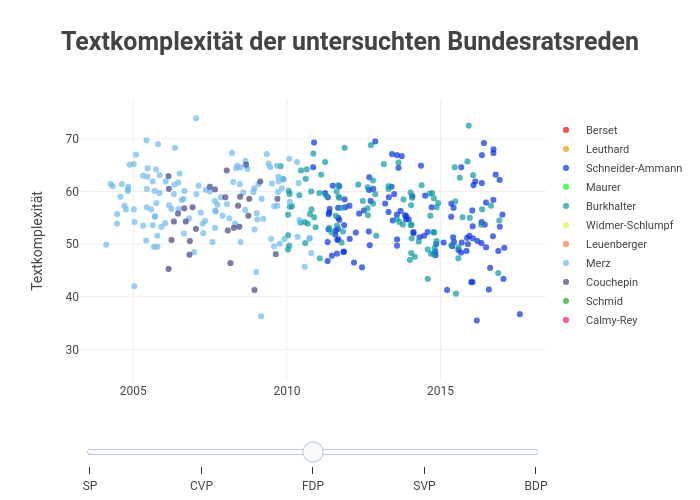
Alfell's interactive graph and data of "Textkomplexität der untersuchten Bundesratsreden" is a scatter chart, showing Column 4; with Textkomplexität in the y-axis. The x-axis shows values from 2003-04-08 01:28:24.4248 to 2018-06-06 22:31:35.5752. The y-axis shows values from 23.829138166894666 to 77.37086183310534.