Edit chart
Loading graph
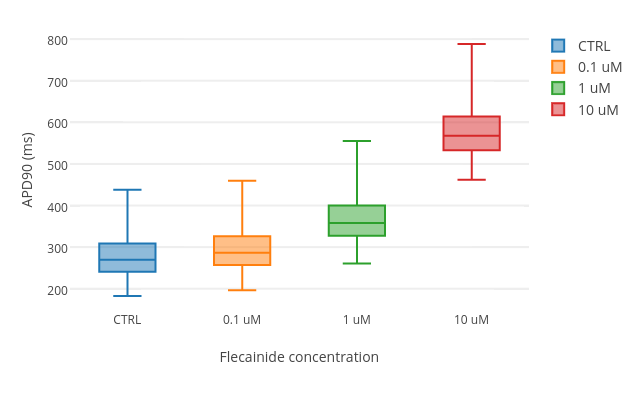
Alfonso.bueno's interactive graph and data of "APD90 (ms) vs Flecainide concentration" is a box plot, showing CTRL, 0.1 uM, 1 uM, 10 uM; with Flecainide concentration in the x-axis and APD90 (ms) in the y-axis.. The x-axis shows values from -0.5 to 3.5. The y-axis shows values from 148.87666666666667 to 821.9433333333333.