Edit chart
Loading graph
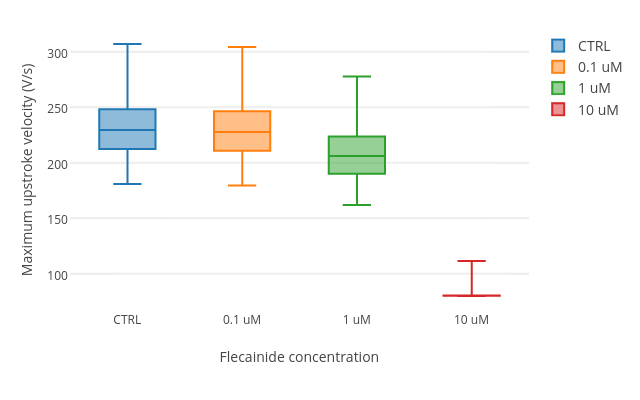
Alfonso.bueno's interactive graph and data of "Maximum upstroke velocity (V/s) vs Flecainide concentration" is a box plot, showing CTRL, 0.1 uM, 1 uM, 10 uM; with Flecainide concentration in the x-axis and Maximum upstroke velocity (V/s) in the y-axis.. The x-axis shows values from -0.5 to 3.5. The y-axis shows values from 67.23313888888889 to 319.6403611111111.