Edit chart
Loading graph
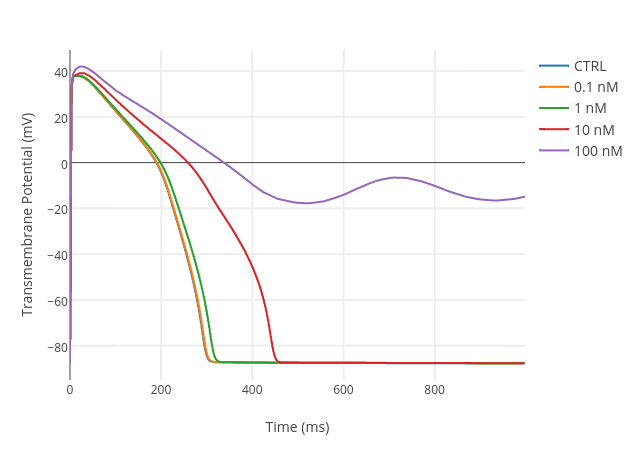
Alfonso.bueno's interactive graph and data of "Transmembrane Potential (mV) vs Time (ms)" is a scatter chart, showing CTRL, 0.1 nM, 1 nM, 10 nM, 100 nM; with Time (ms) in the x-axis and Transmembrane Potential (mV) in the y-axis.. The x-axis shows values from 0 to 998. The y-axis shows values from -95.0111111111111 to 49.21111111111111.