Edit chart
Loading graph
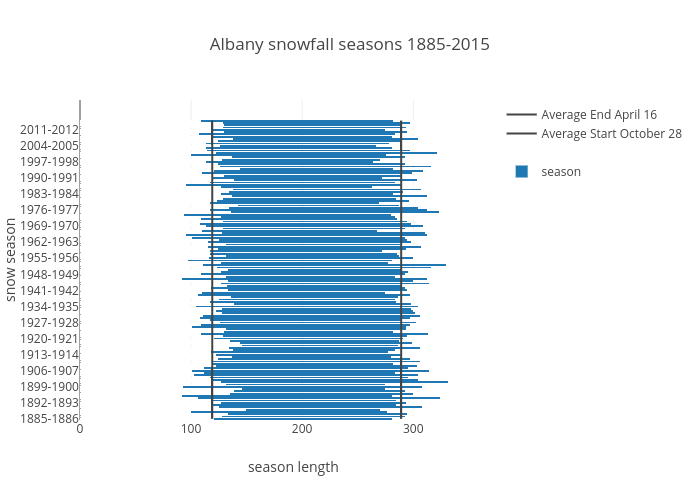
Alloveralbany's interactive graph and data of "Albany snowfall seasons 1885-2015" is a stacked bar chart, showing , season, , Average Start October 28, Average End April 16; with season length in the x-axis and snow season in the y-axis.. The x-axis shows values from 0 to 384.2105263157894. The y-axis shows values from -0.4999999999999929 to 138.9736842105263.