Edit chart
Loading graph
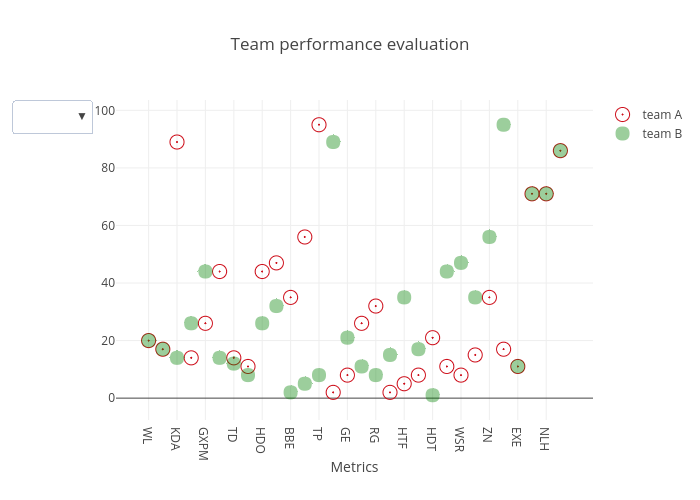
Andinua's interactive graph and data of "Team performance evaluation" is a scatter chart, showing team A vs team B; with Metrics in the x-axis. The x-axis shows values from -1.9995178399228541 to 30.999517839922856. The y-axis shows values from -8.119402985074627 to 104.11940298507463.