Edit chart
Loading graph
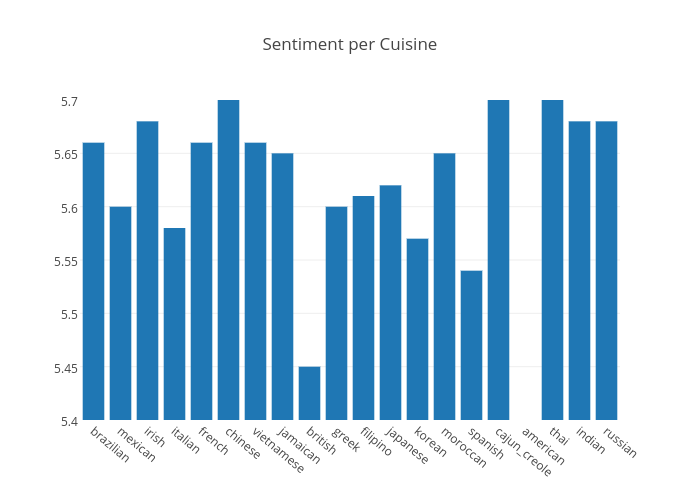
Andreaque's interactive graph and data of "Sentiment per Cuisine" is a bar chart. The x-axis shows values from 0 to 0. The y-axis shows values from 5.4 to 5.7.