Edit chart
Loading graph
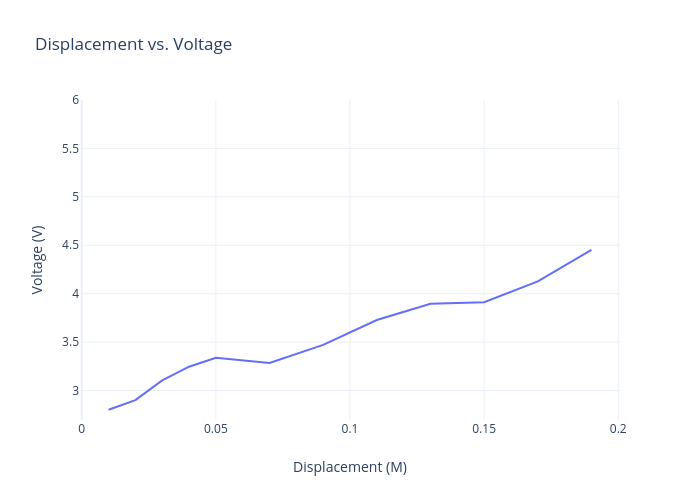
Andrew.j.stephens's interactive graph and data of "Displacement vs. Voltage" is a line chart; with Displacement (M) in the x-axis and Voltage (V) in the y-axis.. The x-axis shows values from -0.0006456611570247947 to 0.20064566115702478. The y-axis shows values from 2.6956053984575834 to 6.