Edit chart
Loading graph
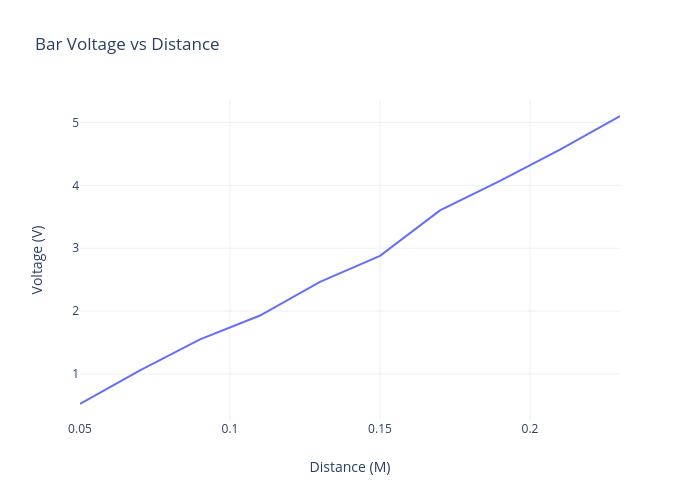
Andrew.j.stephens's interactive graph and data of "Bar Voltage vs Distance" is a line chart; with Distance (M) in the x-axis and Voltage (V) in the y-axis.. The x-axis shows values from 0.05 to 0.23. The y-axis shows values from 0.26861111111111113 to 5.3563888888888895.