Edit chart
Loading graph
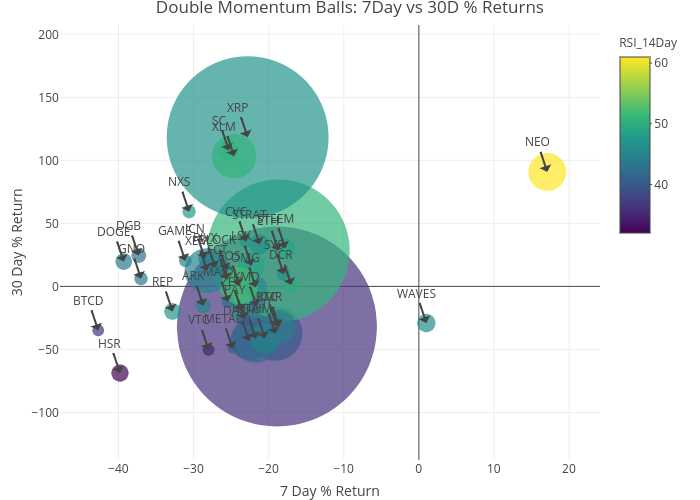
Andrewjim2213's interactive graph and data of "Double Momentum Balls: 7Day vs 30D % Returns" is a scatter chart; with 7 Day % Return in the x-axis and 30 Day % Return in the y-axis.. The x-axis shows values from 0 to 0. The y-axis shows values from 0 to 0. This visualization has the following annotations: BTC; LTC; ETH; XRP; DASH; XMR; VTC; FCT; SC; BTCD; XEM; MAID; NXS; XLM; DGB; GAME; BLOCK; DOGE; SYS; ZEC; IOTA; NEO; OMG; LSK; QTUM; STRAT; WAVES; ARK; STEEM; EOS; REP; PAY; DCR; KMD; HSR; PIVX; METAL; ICN; CVC; GNO