Edit chart
Loading graph
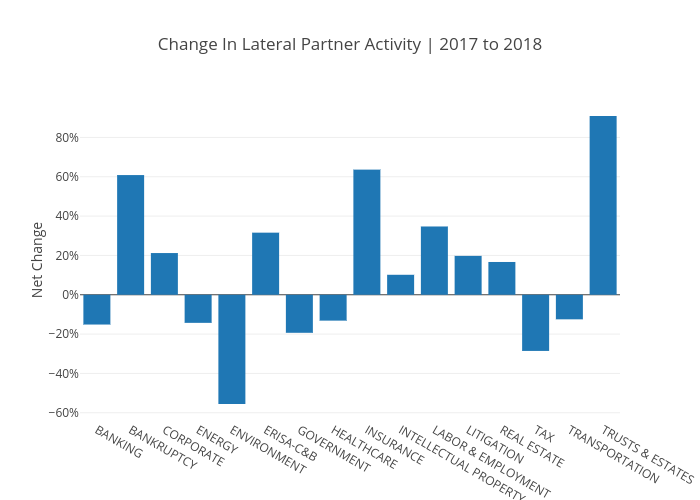
Andylawood's interactive graph and data of "Change In Lateral Partner Activity | 2017 to 2018" is a bar chart, showing B; with in the x-axis and Net Change in the y-axis.. The x-axis shows values from -0.5 to 15.5. The y-axis shows values from -63.69722222222222 to 99.04722222222222.