Edit chart
Loading graph
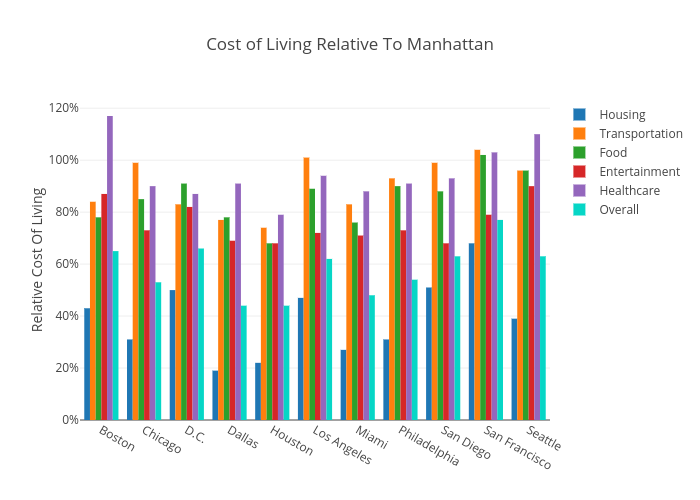
Andylawood's interactive graph and data of "Cost of Living Relative To Manhattan" is a bar chart, showing Housing, Transportation, Food, Entertainment, Healthcare, Overall; with Relative Cost Of Living in the y-axis. The x-axis shows values from -0.5 to 10.5. The y-axis shows values from 0 to 123.15789473684211.