Edit chart
Loading graph
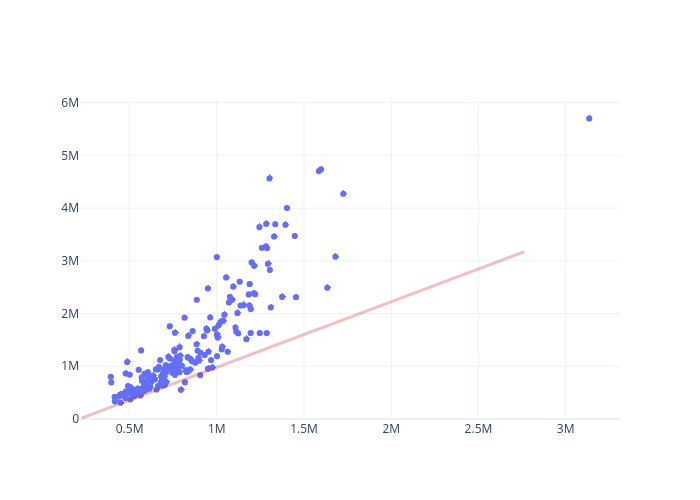
Andylawood's interactive graph and data of "RPL vs. PPP" is a scatter chart, showing RPL vs PPP; with RPL in the x-axis and PPP in the y-axis.. The x-axis shows values from 223698.83594204267 to 3296632.47630166. The y-axis shows values from -18530.992868897272 to 6050234.777838727.