Edit chart
Loading graph
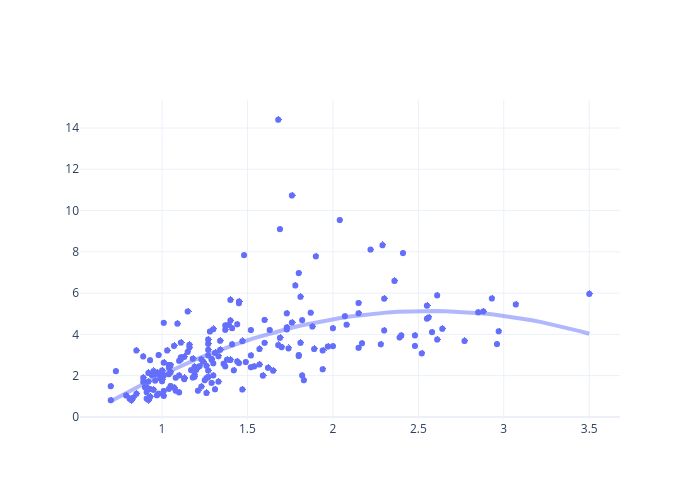
Andylawood's interactive graph and data of "Profitability Index Vs. Leverage" is a scatter chart, showing ; with Leverage in the x-axis and Profitability in the y-axis.. The x-axis shows values from 0.5354089219330854 to 3.6645910780669144. The y-axis shows values from -0.04853812397147528 to 15.258538123971476.