Edit chart
Loading graph
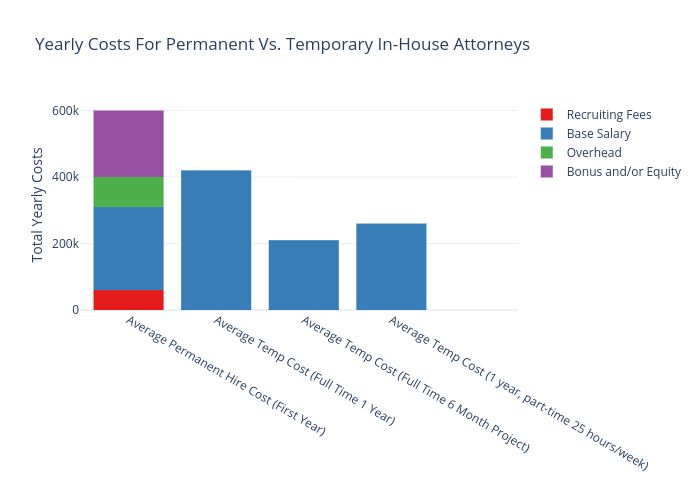
Andylawood's interactive graph and data of "Yearly Costs For Permanent Vs. Temporary In-House Attorneys" is a , showing Recruiting Fees, Base Salary, Overhead, Bonus and/or Equity; with Total Yearly Costs in the y-axis. The x-axis shows values from 0.4455587392550143 to 5.445558739255015. The y-axis shows values from 0 to 631578.947368421.