Edit chart
Loading graph
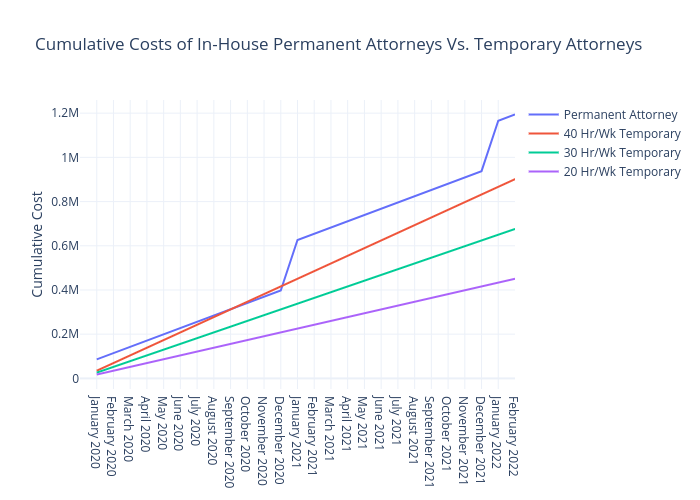
Andylawood's interactive graph and data of "Cumulative Costs of In-House Permanent Attorneys Vs. Temporary Attorneys" is a line chart, showing Permanent Attorney, 40 Hr/Wk Temporary, 30 Hr/Wk Temporary, 20 Hr/Wk Temporary; with Cumulative Cost in the y-axis. The x-axis shows values from 0 to 26. The y-axis shows values from -48046.166666666664 to 1259537.1666666667.