Edit chart
Loading graph
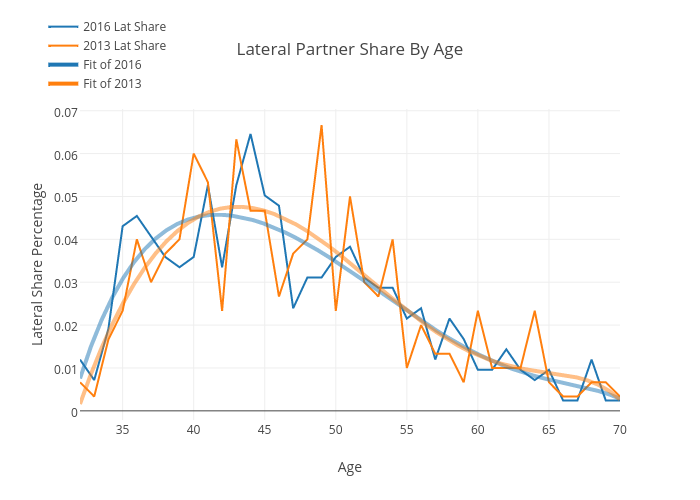
Andylawood's interactive graph and data of "Lateral Partner Share By Age" is a line chart, showing 2016 Lat Share, 2013 Lat Share, Fit of 2016, Fit of 2013, ; with Age in the x-axis and Lateral Share Percentage in the y-axis.. The x-axis shows values from 32 to 70. The y-axis shows values from -0.0020187736047564556 to 0.07028169018972402.