Edit chart
Loading graph
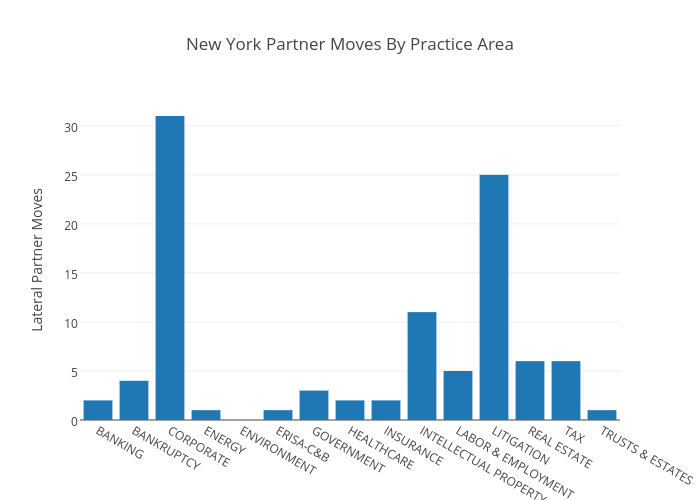
Andylawood's interactive graph and data of "New York Partner Moves By Practice Area" is a bar chart, showing B; with Lateral Partner Moves in the y-axis. The x-axis shows values from -0.5 to 14.5. The y-axis shows values from 0 to 32.631578947368425.