Edit chart
Loading graph
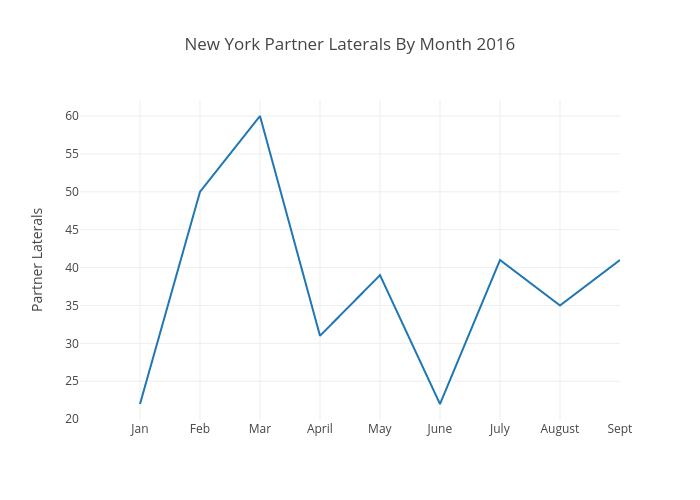
Andylawood's interactive graph and data of "New York Partner Laterals By Month 2016" is a line chart, showing B; with Partner Laterals in the y-axis. The x-axis shows values from 0 to 9. The y-axis shows values from 19.88888888888889 to 62.111111111111114.