Edit chart
Loading graph
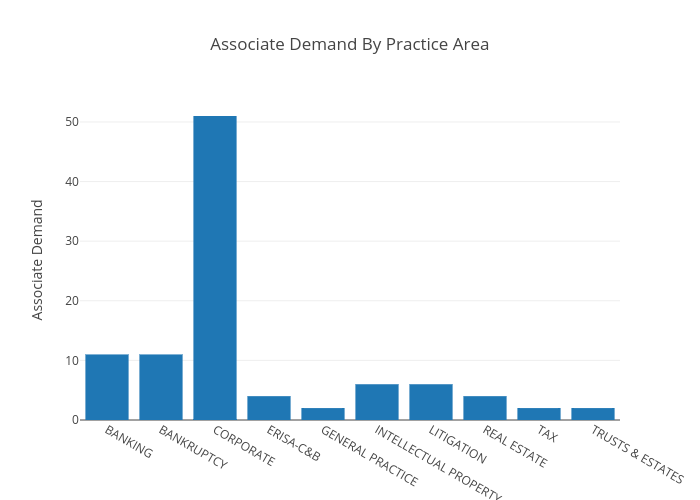
Andylawood's interactive graph and data of "Associate Demand By Practice Area" is a bar chart, showing B; with Associate Demand in the y-axis. The x-axis shows values from -0.5 to 9.5. The y-axis shows values from 0 to 53.68421052631579.