Edit chart
Loading graph
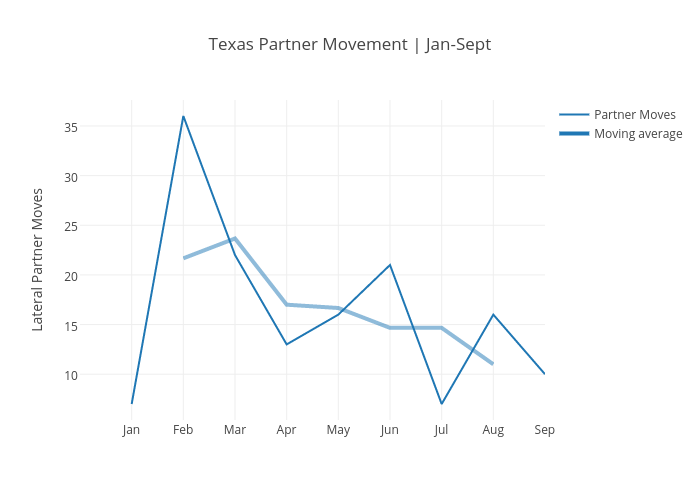
Andylawood's interactive graph and data of "Texas Partner Movement | Jan-Sept" is a line chart, showing Partner Moves vs Moving average; with in the x-axis and Lateral Partner Moves in the y-axis.. The x-axis shows values from 0 to 9. The y-axis shows values from 5.388888888888889 to 37.611111111111114.