Edit chart
Loading graph
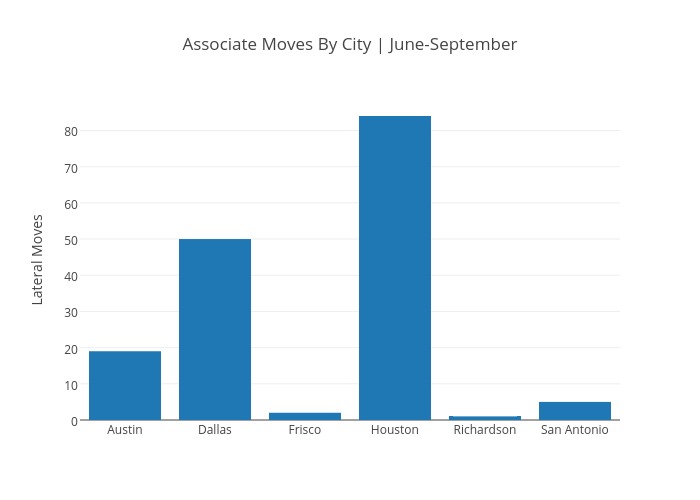
Andylawood's interactive graph and data of "Associate Moves By City | June-September" is a bar chart, showing B; with Lateral Moves in the y-axis. The x-axis shows values from -0.5 to 5.5. The y-axis shows values from 0 to 88.42105263157895.