Edit chart
Loading graph
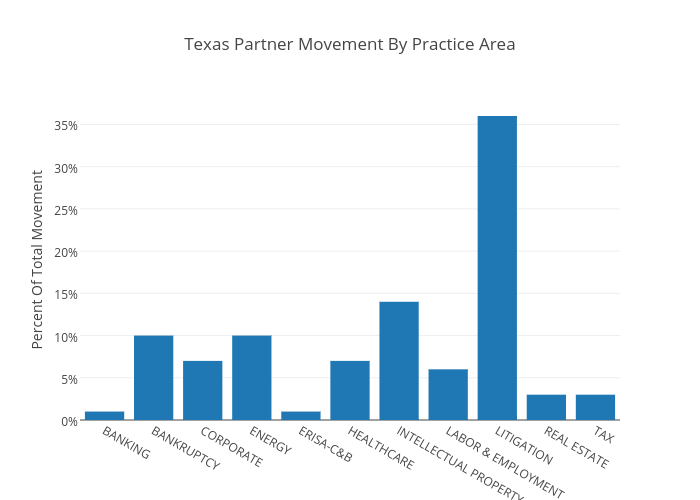
Andylawood's interactive graph and data of "Texas Partner Movement By Practice Area" is a bar chart, showing B; with Percent Of Total Movement in the y-axis. The x-axis shows values from -0.5 to 10.5. The y-axis shows values from 0 to 37.89473684210526.