Edit chart
Loading graph
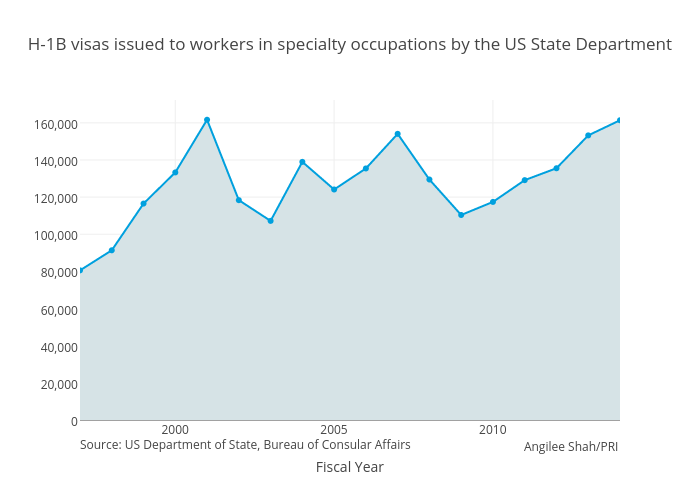
Angshah's interactive graph and data of "H-1B visas issued to workers in specialty occupations by the US State Department" is a filled scatter chart, showing y; with Fiscal Year in the x-axis. The x-axis shows values from 1997 to 2014. The y-axis shows values from 0 to 171225.0707308858. This visualization has the following annotations: Source: US Department of State, Bureau of Consular Affairs ; Angilee Shah/PRI