Edit chart
Loading graph
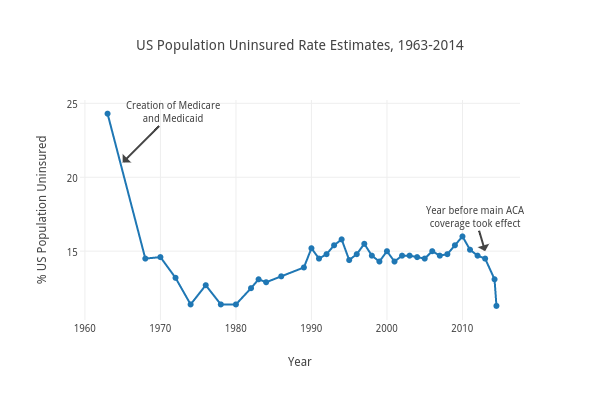
Annalizhaz's interactive graph and data of "US Population Uninsured Rate Estimates, 1963-2014" is a line chart, showing Col2; with Year in the x-axis and % US Population Uninsured in the y-axis.. The x-axis shows values from 1959.3500847039804 to 2017.6197544716276. The y-axis shows values from 10.34705321787659 to 25.225684442991238. This visualization has the following annotations: Year before main ACAcoverage took effect; Creation of Medicareand Medicaid