Edit chart
Loading graph
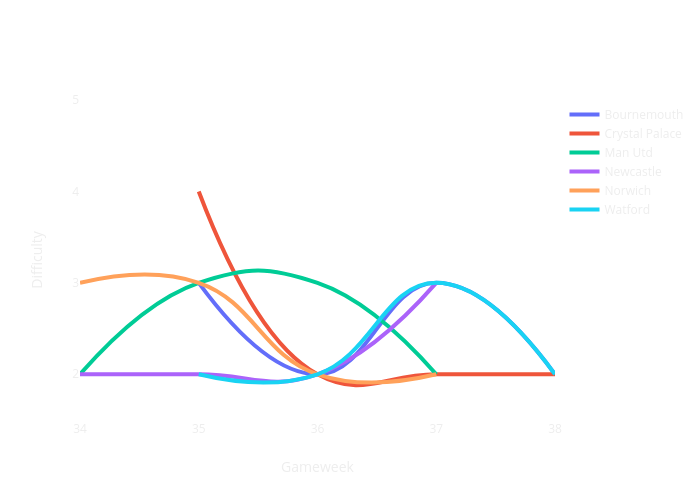
Antoniaelek's interactive graph and data of "Difficulty vs Gameweek" is a line chart, showing Bournemouth, Crystal Palace, Man Utd, Newcastle, Norwich, Watford; with Gameweek in the x-axis and Difficulty in the y-axis.. The x-axis shows values from [34] to [39]. The y-axis shows values from 1.5 to 5.