Edit chart
Loading graph
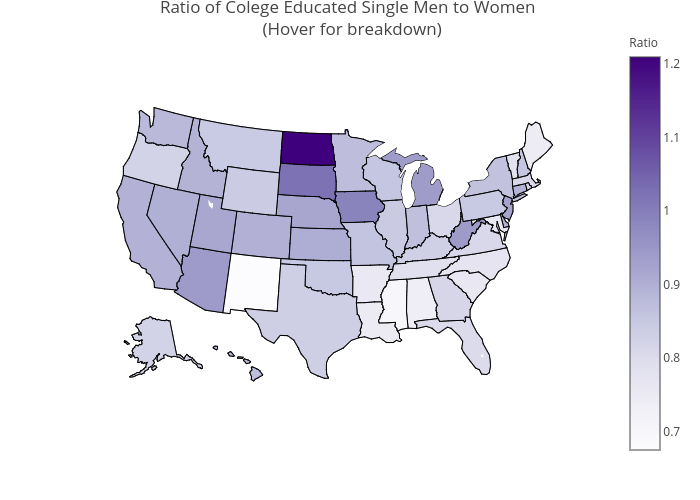
Apapiu's interactive graph and data of "Ratio of Colege Educated Single Men to Women (Hover for breakdown)" is a choropleth. The x-axis shows values from 0 to 0. The y-axis shows values from 0 to 0.