Edit chart
Loading graph
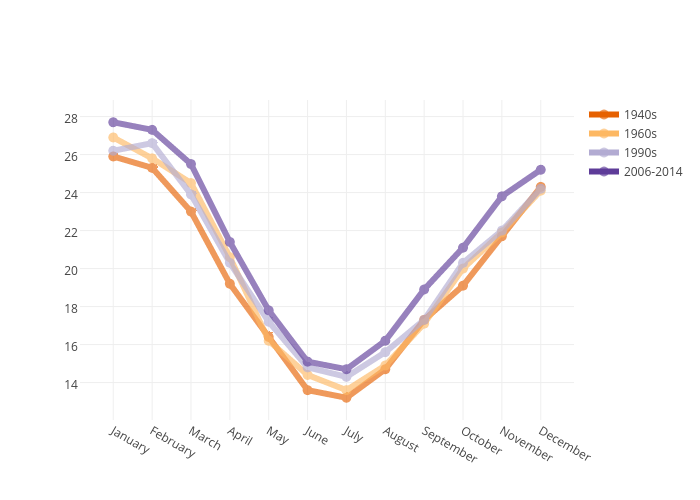
Areff20000's interactive graph and data of "1940s, 1960s, 1990s, 2006-2014" is a scatter chart, showing 1940s, 1960s, 1990s, 2006-2014. The x-axis shows values from -0.7214677838774921 to 11.721467783877491. The y-axis shows values from 12.054490209318027 to 28.84550979068197.