Edit chart
Loading graph
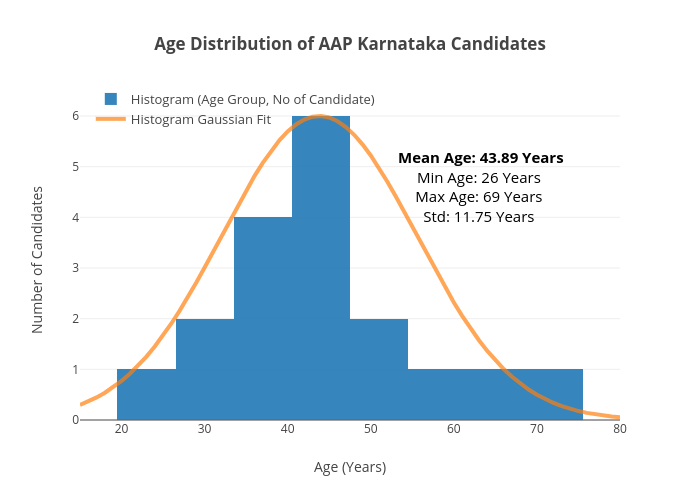
Aroshan's interactive graph and data of "Age Distribution of AAP Karnataka Candidates" is a histogram, showing Histogram (Age Group, No of Candidate) vs Histogram Gaussian Fit ; with Age (Years) in the x-axis and Number of Candidates in the y-axis.. The x-axis shows values from 15 to 80. The y-axis shows values from 0 to 6.315789473684211. This visualization has the following annotation: Mean Age: 43.89 YearsMin Age: 26 Years Max Age: 69 Years Std: 11.75 Years