Edit chart
Loading graph
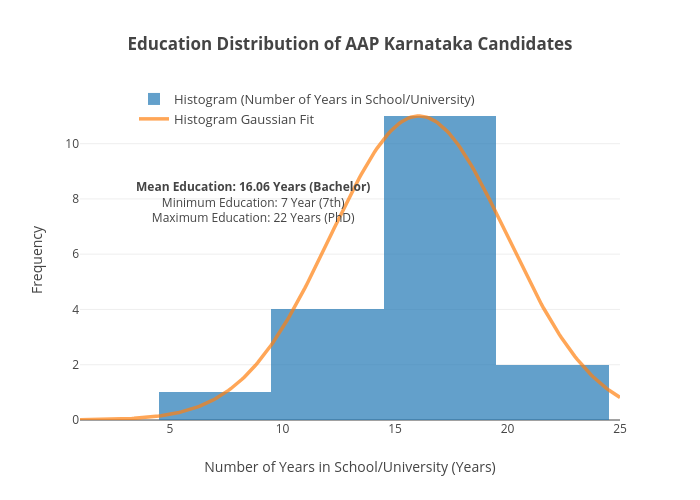
Aroshan's interactive graph and data of "Education Distribution of AAP Karnataka Candidates" is a histogram, showing Histogram (Number of Years in School/University) vs Histogram Gaussian Fit ; with Number of Years in School/University (Years) in the x-axis and Frequency in the y-axis.. The x-axis shows values from 1 to 25. The y-axis shows values from 0 to 11.578947368421053. This visualization has the following annotation: Mean Education: 16.06 Years (Bachelor) Minimum Education: 7 Year (7th) Maximum Education: 22 Years (PhD)