Edit chart
Loading graph
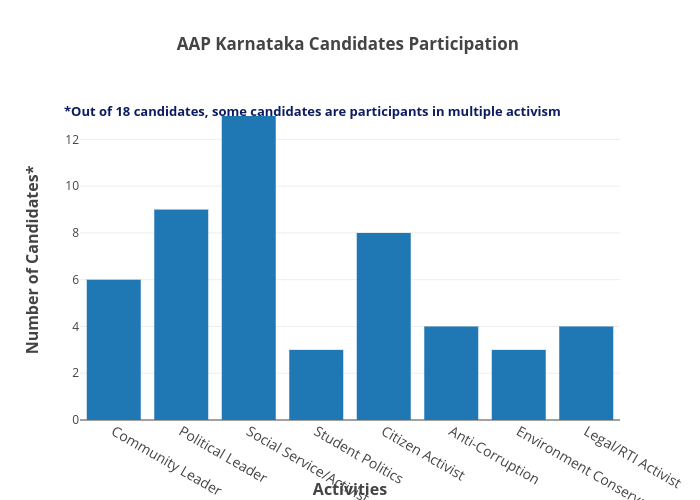
Aroshan's interactive graph and data of "AAP Karnataka Candidates Participation " is a bar chart, showing B; with Activities in the x-axis and Number of Candidates* in the y-axis.. The x-axis shows values from -0.5 to 7.5. The y-axis shows values from 0 to 13.68421052631579. This visualization has the following annotation: *Out of 18 candidates, some candidates are participants in multiple activism