Edit chart
Loading graph
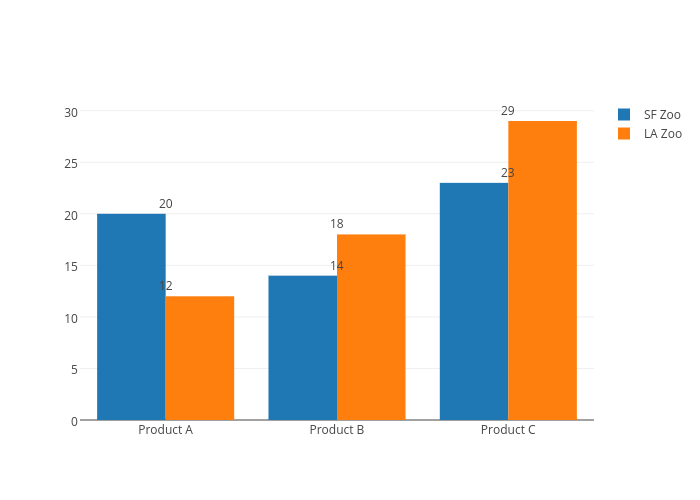
Ashish.baghudana's interactive graph and data of "SF Zoo vs LA Zoo" is a grouped bar chart, showing SF Zoo vs LA Zoo. The x-axis shows values from 0 to 0. The y-axis shows values from 0 to 0. This visualization has the following annotations: 20; 14; 23; 12; 18; 29