Edit chart
Loading graph
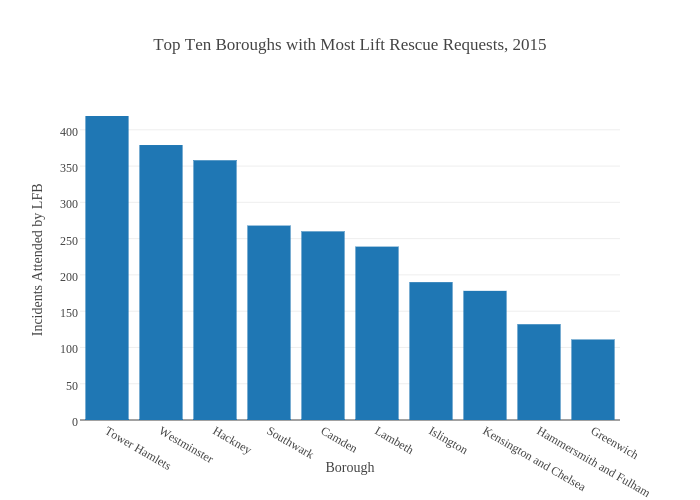
Ashultes92's interactive graph and data of "Top Ten Boroughs with Most Lift Rescue Requests, 2015" is a bar chart, showing Col2; with Borough in the x-axis and Incidents Attended by LFB in the y-axis.. The x-axis shows values from 0.5 to 10.5. The y-axis shows values from 0 to 441.0526315789474.