Edit chart
Loading graph
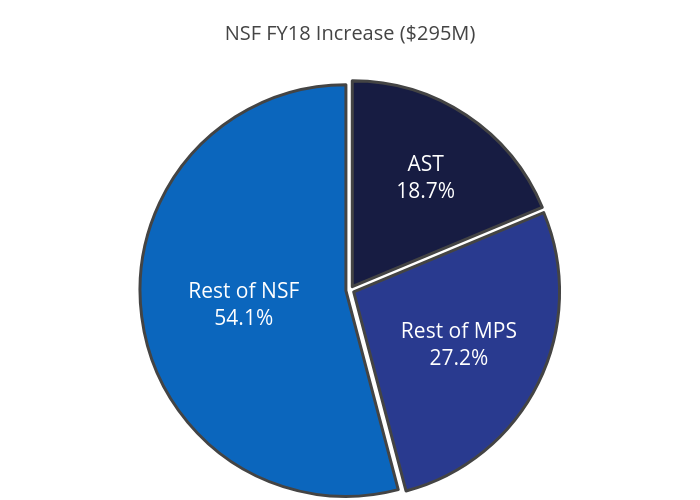
Astroashlee's interactive graph and data of "NSF FY18 Increase ($295M)" is a pie, showing NSF FY18 Increase: Where did it go? . The x-axis shows values from -1 to 6. The y-axis shows values from -1 to 4.