Edit chart
Loading graph
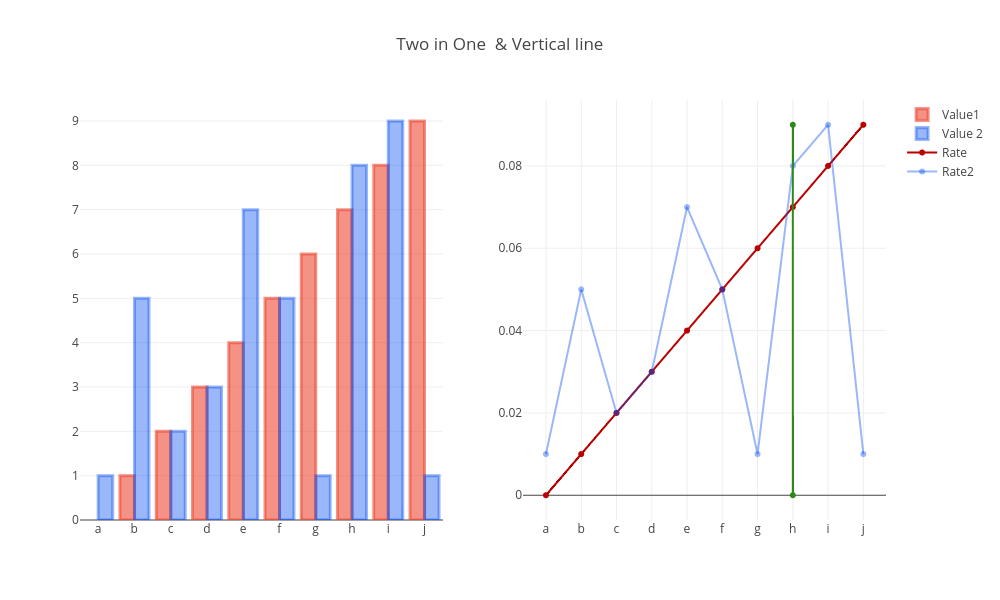
Athean's interactive graph and data of "Two in One & Vertical line" is a bar chart, showing Value1, Value 2, Rate, Rate2. The x-axis shows values from 0 to 0. The y-axis shows values from 0 to 0.