Edit chart
Loading graph
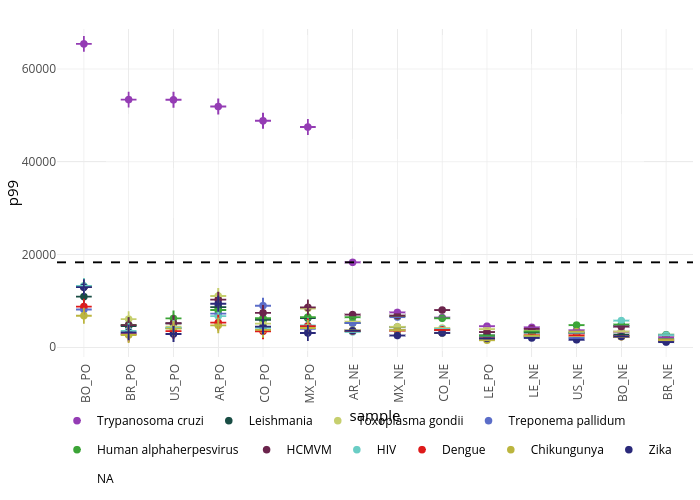
Atm44's interactive graph and data of "p99 vs sample" is a scatter chart, showing Trypanosoma cruzi, Leishmania, Toxoplasma gondii, Treponema pallidum, Human alphaherpesvirus , HCMVM, HIV, Dengue, Chikungunya, Zika, NA, Trypanosoma cruzi, Leishmania, Toxoplasma gondii, Treponema pallidum, Human alphaherpesvirus , HCMVM, HIV, Dengue, Chikungunya, Zika, NA, Trypanosoma cruzi, Leishmania, Toxoplasma gondii, Treponema pallidum, Human alphaherpesvirus , HCMVM, HIV, Dengue, Chikungunya, Zika, NA; with sample in the x-axis and p99 in the y-axis.. The x-axis shows values from 0.4 to 14.6. The y-axis shows values from -2070.907635 to 68616.338335. This visualization has the following annotation: organism