Edit chart
Loading graph
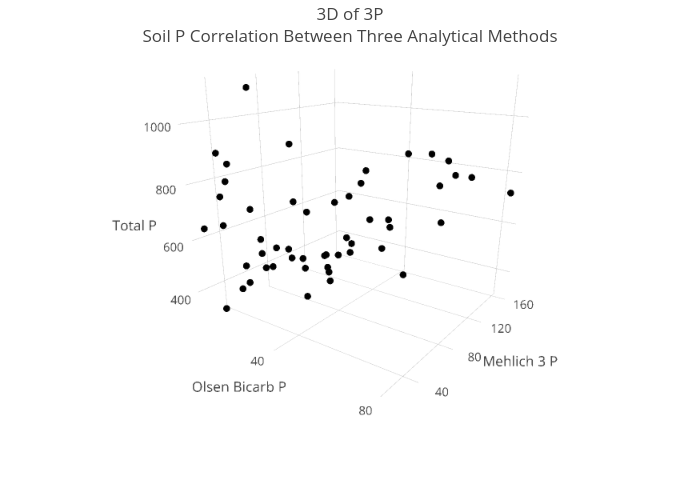
Awpearce's interactive graph and data of "3D of 3PSoil P Correlation Between Three Analytical Methods" is a scatter3d, showing p_total; with p_olsen in the x-axis and p_meh3 in the y-axis.. The x-axis shows values from 0 to 0. The y-axis shows values from 0 to 0.