Edit chart
Loading graph
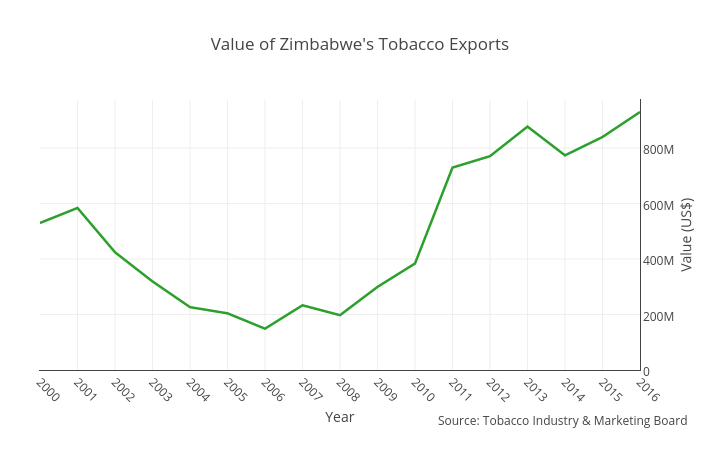
Bachandphoto's interactive graph and data of "Value of Zimbabwe's Tobacco Exports" is a line chart, showing Value (US$) ; with Year in the x-axis and Value (US$) in the y-axis.. The x-axis shows values from 2000 to 2016. The y-axis shows values from 0 to 973391348.2222222. This visualization has the following annotation: Source: Tobacco Industry & Marketing Board