Edit chart
Loading graph
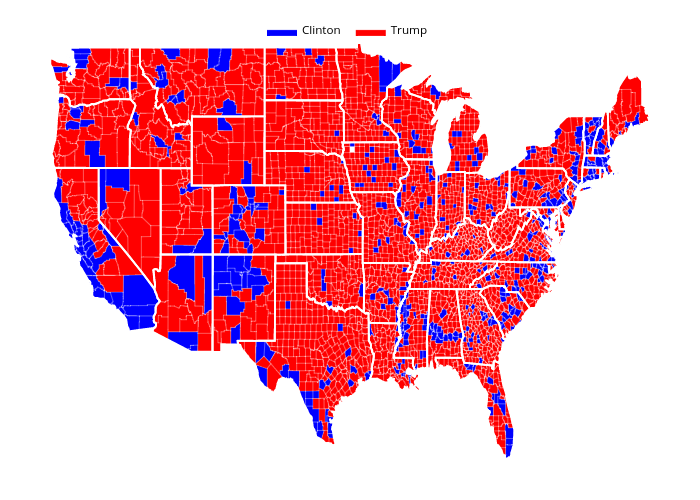
Bdun9's interactive graph and data of "Clinton vs Trump" is a filled line chart, showing Clinton vs Trump. The x-axis shows values from -127.56503944397 to -64.1237194061279. The y-axis shows values from 23.9172634124756 to 50.5958972930908.