Edit chart
Loading graph
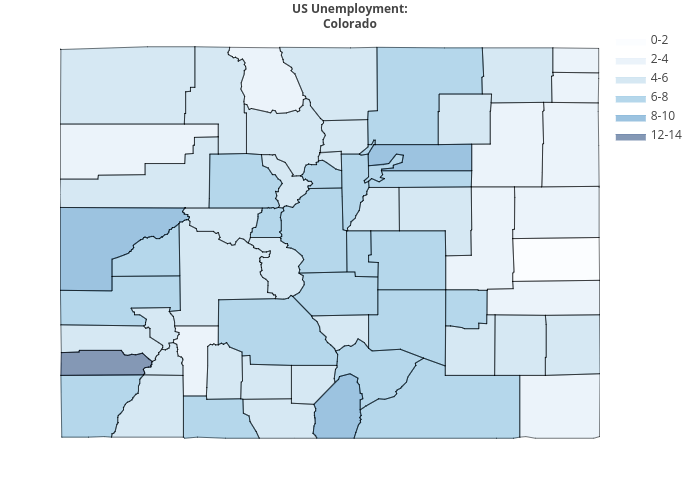
Bdun9's interactive graph and data of "US Unemployment:Colorado" is a filled line chart, showing 0-2, 2-4, 4-6, 6-8, 8-10, 12-14, 0-2, 2-4, 4-6, 6-8, 8-10, 12-14. The x-axis shows values from 0 to 0. The y-axis shows values from 0 to 0.