Edit chart
Loading graph
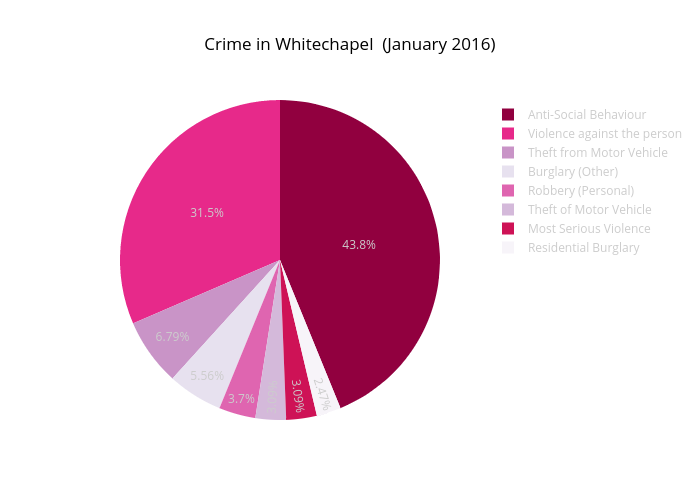
Beckyh114's interactive graph and data of "Crime in Whitechapel (January 2016)" is a pie, showing Col2. The x-axis shows values from 0 to 0. The y-axis shows values from 0 to 0.