Edit chart
Loading graph
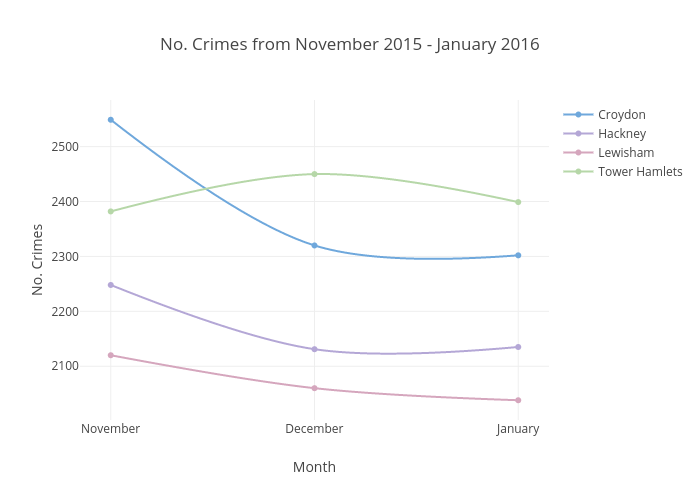
Beckyh114's interactive graph and data of "No. Crimes from November 2015 - January 2016" is a scatter chart, showing Croydon, Hackney, Lewisham, Tower Hamlets; with Month in the x-axis and No. Crimes in the y-axis.. The x-axis shows values from -0.1259323006310958 to 2.1259323006310957. The y-axis shows values from 2002.5632240979808 to 2584.4367759020192.