Edit chart
Loading graph
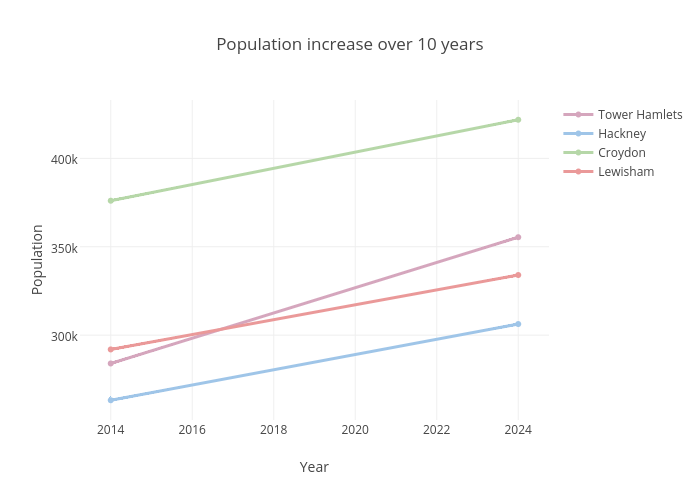
Beckyh114's interactive graph and data of "Population increase over 10 years" is a scatter chart, showing Tower Hamlets, Hackney, Croydon, Lewisham; with Year in the x-axis and Population in the y-axis.. The x-axis shows values from 2013.2998438313377 to 2024.7001561686623. The y-axis shows values from 252097.2792792793 to 432928.7207207207.