Edit chart
Loading graph
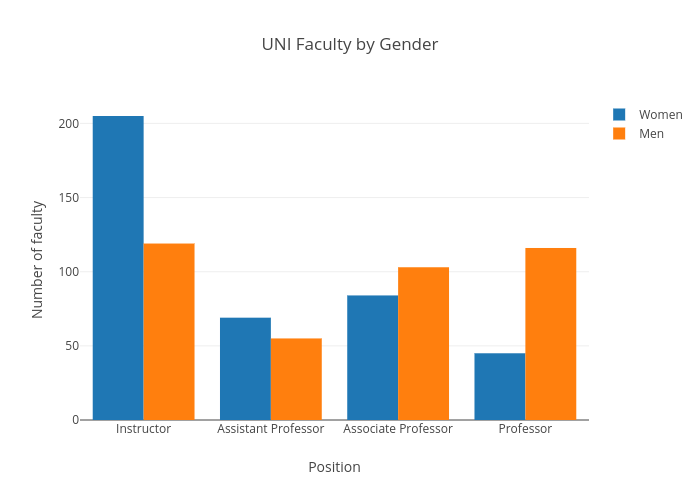
Bekdale's interactive graph and data of "UNI Faculty by Gender" is a bar chart, showing Women vs Men; with Position in the x-axis and Number of faculty in the y-axis.. The x-axis shows values from -0.5 to 3.5. The y-axis shows values from 0 to 215.78947368421052.